See equipment problems before they become downtime
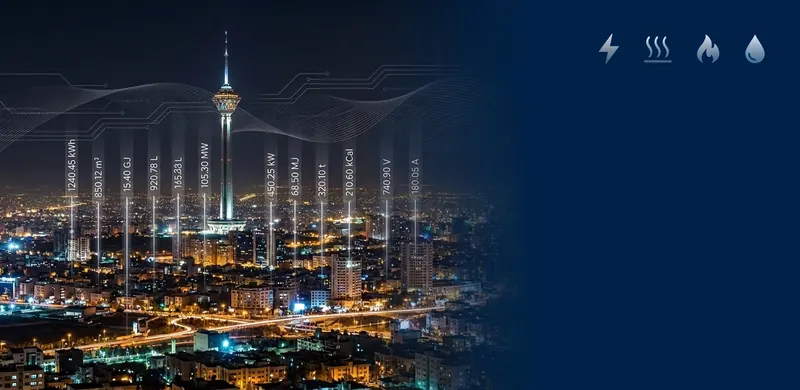
Bruntab combines smart data loggers with online monitoring to track temperature, humidity, pressure, differential pressure, leaks, CO₂ and electrical parameters across HVAC and industrial assets—and alert your team when conditions leave their safe range.
Equipment failures are rarely sudden—the early signals simply go unseen
When technicians record conditions only during scheduled rounds, critical changes between inspections disappear. Operations learns about the problem only after comfort, process quality or production has already been affected.
Late warnings
Rising temperature, pressure loss or leakage is discovered only after conditions become critical.
Fragmented manual logs
Paper forms and separate files cannot show a continuous trend or the exact time of an event.
Unplanned downtime
A small chiller, AHU, boiler-room or cold-store fault can become an expensive interruption.
No defensible history
Without continuous records, root-cause analysis and repair validation depend on guesswork.
Hidden energy waste
Operation outside the efficient range increases wear as well as water, power and fuel costs.
Unfocused site visits
Technicians travel to inspect assets that may be operating normally.
Quality and safety exposure
Out-of-range temperature, humidity, CO₂ or differential pressure can threaten products and people.
Reactive maintenance
Maintenance begins after failure instead of responding to the asset’s actual condition.
From raw measurements to maintenance decisions
A data logger measures, records and stores data over time. It can collect temperature, humidity, pressure, differential pressure, voltage, current, power, CO₂, digital-input status and leak signals from internal or external sensors.
Bruntab automatically sends those readings to a web platform. Authorized teams can view trends and history from a computer or phone, define operating limits for each point and receive alerts when conditions leave the approved range.
This creates a practical foundation for condition-based and preventive maintenance: technicians can intervene before downtime and support every decision with evidence.
Assess your monitoring points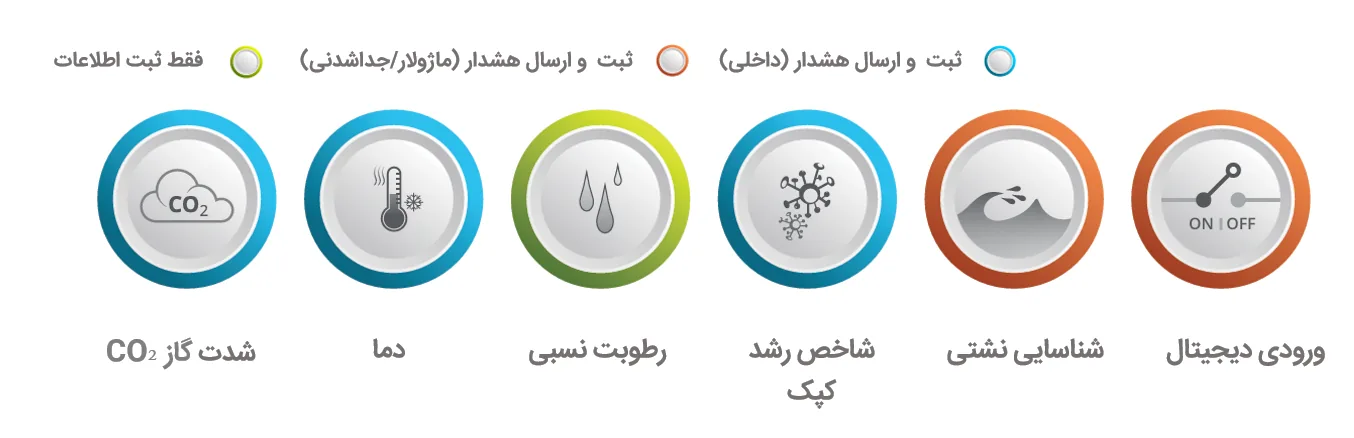
Four steps from sensor to preventive action
Every deployment is designed around its measurement points, safe limits, communications range and environmental conditions.
- 1
Measure
The selected sensor measures critical asset or environmental parameters at the required interval.
- 2
Log and transmit
The logger stores readings and sends them to the platform through the selected wireless or cellular link.
- 3
Analyze and alert
The software presents trends and alerts the responsible team when a threshold is exceeded.
- 4
Act and document
Technicians intervene using real evidence, while the record helps validate the result of the repair.
Actionable data for every critical point
Bruntab monitoring can scale from one standalone asset to a network of measurement points across several buildings or industrial sites.
Chillers and boiler rooms
Monitor temperature, pressure, differential pressure and hydronic system conditions.
AHUs and clean rooms
Control temperature, humidity, CO₂ and pressure relationships for reliable indoor conditions.
Cold stores and sensitive stock
Record temperature continuously and alert teams before food, medicine or goods are exposed.
Production and industrial processes
Capture critical process conditions and build a traceable quality record.
Electrical panels and assets
Monitor voltage, current, power and critical temperatures for abnormal behavior.
Pumps, tanks and fluid networks
Track fluid pressure and temperature, pressure-based level and leakage.
Data centers and server rooms
Monitor temperature, humidity and water leaks before equipment is damaged.
Museums, laboratories and agriculture
Maintain stable environmental conditions with documented histories.
One instrument does not fit every project
Bruntab recommends the appropriate logger and sensor combination after reviewing the environment, measurement range, required accuracy and alerting needs.
Temperature and humidity logger
Sensitive rooms, boiler rooms, storage, museums and building management.
View specifications →External temperature logger
Cold stores, pipes, enclosures and very hot or cold environments.
View specifications →Two external temperatures logger
Compare supply and return or monitor two independent compartments.
View specifications →Fluid pressure and temperature logger
Water and fluid networks, tanks and industrial applications with optional inputs.
View specifications →CO₂, temperature and humidity logger
Indoor-air monitoring for AHUs, occupied spaces and sensitive environments.
View specifications →Air differential pressure logger
Filter, clean-room, duct and HVAC performance monitoring.
View specifications →From technical survey to operation and support
A logger creates value only when the right point is measured, alerts are meaningful and the resulting data is connected to the real maintenance process.
Assessment and design
Identify critical assets, measurement points, risks and implementation priorities.
Logger and sensor selection
Specify measurement range, accuracy, inputs, communications and installation conditions.
Installation and commissioning
Install hardware, identify points, test communications and hand over a working platform.
Alert configuration
Define thresholds, delays and authorized recipients around the actual process.
Dashboards and reporting
Provide trends, raw data, history, periodic reporting and usable exports.
Training and support
Train operations teams and support future expansion and system maintenance.
Better-informed maintenance, less downtime and a defensible record
Continuous data strengthens—not replaces—your technical team’s experience by making decisions faster and easier to document.
Earlier anomaly detection
Abnormal changes become visible before they develop into major failures.
Less unplanned downtime
Timely alerts create room to schedule a repair before operations are disrupted.
Fewer unnecessary visits
Technicians review conditions remotely and travel with a clear purpose.
Product and process protection
Temperature, humidity, pressure and air-quality conditions gain a time-stamped record.
Better root-cause analysis
Before-and-after trends support diagnosis and help validate the repair.
Energy and asset optimization
Operation outside the efficient range is identified sooner.
What should you know before designing a monitoring system?
What is a data logger, and how is it different from a simple display?
A display shows only the current value. A data logger time-stamps measurements, builds a history and—within the Bruntab solution—sends data to an online platform for visualization, reporting and alerts.
Is this solution limited to HVAC systems?
No. The same infrastructure can support cold stores, production lines, sensitive storage, electrical panels, tanks, server rooms, laboratories, museums and any process that requires continuous records.
Will readings be lost if the internet connection fails?
Local storage and retransmission behavior depend on the selected logger and project requirements. The technical design reviews continuity, buffering and communications needs for the application.
How are alerts configured?
Minimum and maximum limits, measurement and upload intervals, delays and authorized recipients are configured for each point. Alerts should be actionable without overwhelming the team.
Can we start with a few points and expand later?
Yes. Many projects begin with the most critical assets and add sensors and measurement points after the initial results have been evaluated.
What information is needed for a technical proposal?
Asset or room type, parameter, number of points, measurement range, installation conditions, distances and preferred alerting method form the basis of the initial design and are completed during the site assessment.
Start with your site’s most critical asset
Bruntab’s technical team will review high-risk points, meaningful parameters and the appropriate communication method to prepare a monitoring design that can grow with your facility.
Request a technical consultation